Every so often there will be something that slows a system down. There are a few tools that can help to identify which process is the cause of this slow down. One such tool is htop. Htop is an interactive and real time process monitoring application for Linux which will show you your usage per cpu/core, as well as a meaningful text graph of your memory and swap usage.
Let start by installing htop. To install htop for Ubuntu execute the following command in a terminal
sudo apt-get install htop
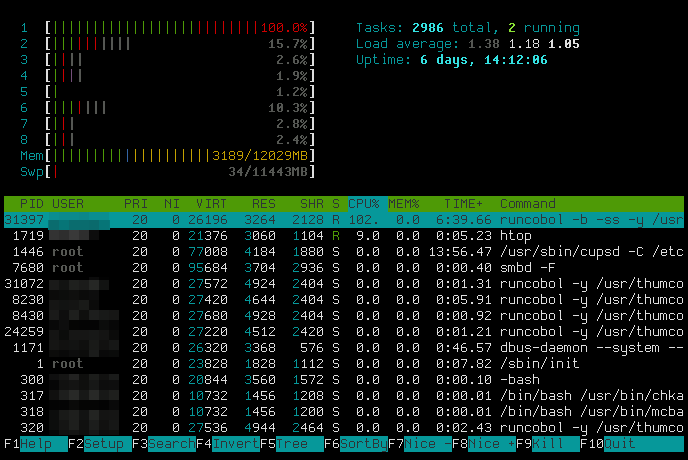
Once installed, just type htop at a terminal to launch it, Here is an example of what htop looks like on my system.

System wide cpu usage:
The numbers on the top left from 1 to 8 represents the number of cpu’s/cores in my system with the progress bar next to them representing the load of cpu/core. As you would have noticed the progress bars can be comprised of different colors. The following list will explain what each color means.
Blue: low priority processes (nice > 0)
Green: normal (user) processes
Red: kernel processes
Yellow: IRQ time
Magenta: Soft IRQ time
Grey: IO Wait time
Green: normal (user) processes
Red: kernel processes
Yellow: IRQ time
Magenta: Soft IRQ time
Grey: IO Wait time
System wide memory usage:
Below the cpu progress bars you will see the memory and swap progress bars. Like the cpu progress bars the memory and swap progress bars can be comprised of different colors. Here is a list of what the colors means within relation to the memory and swap progress bars.
Green: Used memory pages
Blue: Buffer pages
Yellow: Cache pages
Blue: Buffer pages
Yellow: Cache pages
Load average:
The system load is a measure of the amount of computational work that a computer system performs. The load average represents the average system load over a period of time. 1.0 on a single core cpu represents 100% utilization. Note that loads can exceed 1.0 this just means that processes have to wait longer for the cpu. 4.0 on a quad core represents 100% utilization. Anything under a 4.0 load average for a quad-core is ok as the load is distributed over the 4 cores.

The first number is a 1 minute load average, second is 5 minutes load average and the third is 15 minutes load average.
Information on processes:
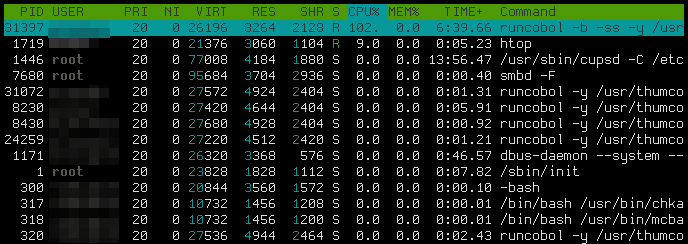
Htop will lists all the running processes on a system with information about how much cpu and memory each process is using as well as the command used to start the process.

Here is a list that explains what each column means.
PID: A process’s process ID number.
USER: The process’s owner.
PR: The process’s priority. The lower the number, the higher the priority.
NI: The nice value of the process, which affects its priority.
VIRT: How much virtual memory the process is using.
RES: How much physical RAM the process is using, measured in kilobytes.
SHR: How much shared memory the process is using.
S: The current status of the process (zombied, sleeping, running, uninterruptedly sleeping, or traced).
%CPU: The percentage of the processor time used by the process.
%MEM: The percentage of physical RAM used by the process.
TIME+: How much processor time the process has used.
COMMAND: The name of the command that started the process.
The difference between VIRT, RES and SHR:
VIRT stands for the virtual size of a process, which is the sum of memory it is actually using, memory it has mapped into itself (for instance the video card’s RAM for the X server), files on disk that have been mapped into it (most notably shared libraries), and memory shared with other processes. VIRT represents how much memory the program is able to access at the present moment.
RES stands for the resident size, which is an accurate representation of how much actual physical memory a process is consuming. (This also corresponds directly to the %MEM column)
SHR indicates how much of the VIRT size is actually sharable memory or libraries. In the case of libraries, it does not necessarily mean that the entire library is resident. For example, if a program only uses a few functions in a library, the whole library is mapped and will be counted in VIRT and SHR, but only the parts of the library file containing the functions being used will actually be loaded in and be counted under RES.
Use htop like a pro:
Htop has some very useful feature built-in to make one’s life easier when working with system processes, here a list of feature that I find very helpful.
Scroll the process list horizontally and vertically using the arrow keys
Kill a process by pressing the F9′ key
Renice a process by pressing the ‘F7′ or ‘F8′ key’s
List open files used by a process by pressing the ‘l’ key
Display only processes of a single user by pressing the ‘u’ key
Display processes sorted by any htop column by pressing the ‘F6′ key
Display processes in a tree view by pressing the ‘F5′ key
Another useful option in htop is the setup menu which can be accessed by pressing the ‘F2′ key. Here you can change the behavior of the meter bar, customize some of the htop display options, choose a color theme for the htop output and choose what columns needs to be displayed for the processes in htop.
Conclusion
Htop is a fantastic tool that is over looked at times. When I suspect that there is performance issues with a system, htop is one of the first tools that I use to start the investigation to what might be causing the problem. I hope someone will find this article useful and if anyone has any question leave a comment below and I will try and answer it.